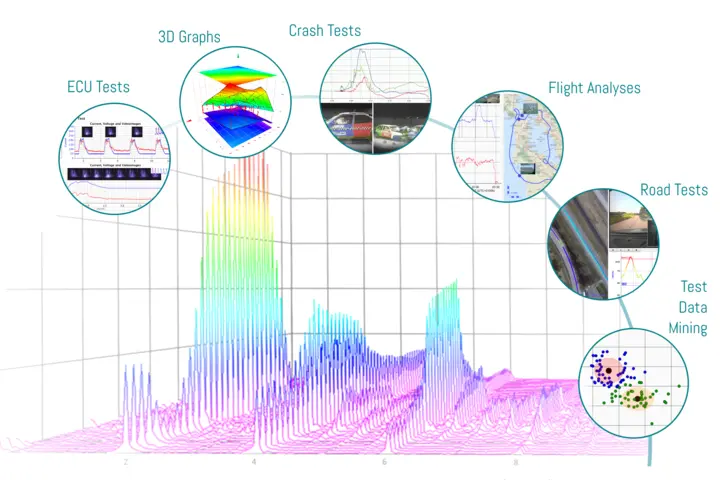
Three-stage tool chain makes synergies possible
So that its customers in the automotive sector can tap these potentials, AMS – A Kistler Group Company – has developed a three-stage tool chain. With its help, measurement data from power train analysis or crash testing – to take only two examples – can now be efficiently evaluated and managed. In addition, targeted searching for correlations is possible so that concealed relationships and causalities can be identified.
'Conventional algorithms such as those originating from Silicon Valley are inadequate for tasks such as these. What's needed here is access based on an engineering approach so that the special nature of the measurement data can be recorded correctly,' according to Dr. Bernhard Sünder, founder and CEO of AMS. 'Over the last 25 years, we have built up the know-how needed to succeed in this field – and our collaboration with OEMs in the automotive sector proves that we are right.'
The central application in the AMS portfolio is jBEAM. It can analyze and visualize virtually any sets of data, which can be inputted in over 100 different file formats. Mathematical algorithms are used to analyze and process the data as appropriate – for example, in the form of editable graphic reports. jBEAM also includes extensive functions for video, audio and positioning data (such as GPS).
'We placed special emphasis on the openness and flexibility of the system: jBEAM is entirely programmed in Java, so it can be used independently of platforms and operating systems. What's more, users can utilize their own algorithms – programmed in MATLAB, for instance – and they can add extra components,' Sünder continues. The AMS portfolio is rounded out by MaDaM, the measurement data management system, and the jBEAM Cluster application for in-depth data analyses across multiple projects – what is known as Data Mining.
The complexities of power trains, NVH and crash tests – reliably under control
AMS focuses its development work on three key application areas, among many others: power train analysis, NVH (Noise, Vibration & Harshness), and crash testing applications – a field that is also one of Kistler's strengths. 'Let's take crash testing as an example: Kistler already offers a complete package comprising the THOR dummy plus specialized sensor technology, as well as crash walls to measure the forces when the vehicle collision takes place. Now, we come along and complete the existing measurement chain with our software. So customers benefit from an even more comprehensive solution, and they can utilize synergies from data acquisition and post-processing,' Sünder points out.
jBEAM makes it easy to combine video sequences and numerical data. The Crash Assistant supports users with generating reports, compares the results with standards such as NCAP, and identifies gaps and possible errors. Test results, videos and images can easily be compared with one another; a comprehensive analysis can be launched with just a few clicks. Again, user-friendliness and adaptability were top priorities during the development of the software.
Data Mining: discovering statistical correlations and putting them to productive use
Before in-depth comparative analyses of large numbers of tests can be undertaken, the first requirement is efficient management of the data volumes that are acquired. This is where MaDaM – the AMS solution for managing measurement data – comes into play. Sünder explains: 'Over 30 MaDaM systems are already operating across the globe. They organize the data that is continuously generated so that it can be flexibly selected and used for comparisons and analyses at a later stage. And thanks to the new Elasticsearch technology, MaDaM is now even faster – there's no test that can't be located.'
At the same time, this creates the conditions required for Data Mining as such. A two-stage process is involved here for measurement data. In the first step, the measurement files are analyzed so that events and statistical variables can be identified. jBEAM Cluster processes these analyses of thousands of measurement files in parallel. In the second step, the interim results are examined with Data Mining algorithms such as pattern recognition or reducing dimensions of relation, in order to find correlations. 'Of course, not every correlation is a causality as well. Experienced development engineers are still needed to make that distinction. But by offering them intelligent post-processing of measurement data, we also make it possible for them to carry out intelligent investigations of existing data stocks.'


